
Introduction
SwiftUI debugging is an essential skill every iOS developer needs to master, especially when working with Previews. SwiftUI Previews promised us instant feedback and rapid iteration, but they can be incredibly frustrating when they break. I’ve lost count of the number of times I’ve stared at the dreaded “Preview crashed” message, wondering what went wrong. The worst part is when your app builds and runs perfectly on the simulator, but the preview refuses to cooperate. This disconnect can slow down your development workflow significantly.
SwiftUI debugging is a critical skill that separates productive developers from those constantly fighting their tools. When previews work, they’re magical—you see changes instantly without rebuilding your entire app. When they don’t, you need a systematic approach to diagnose and fix the issues quickly. This article walks through battle-tested techniques I’ve learned from thousands of preview crashes across multiple production apps.
The key to mastering preview debugging is understanding that previews run in a special environment separate from your main app. They have their own lifecycle, dependencies, and constraints. Once you internalize this mental model, most preview issues become predictable and fixable. Let’s dive into the practical techniques that will transform your SwiftUI debugging workflow.
Why Do SwiftUI Previews Break?
Understanding root causes is the first step to debugging effectively. Previews operate in a sandboxed environment with limited access to resources, which creates unique failure modes you won’t see when running your app normally.
The most common issue is compile-time errors that prevent the preview compiler from generating your view. These are usually straightforward—a missing import, a typo, or a reference to a nonexistent type. But here’s the catch: one broken file in your module can cascade and break previews across your entire project.
Runtime errors are trickier. Your code compiles fine but crashes when the preview executes it. Force unwrapping optionals is the classic culprit. Your production code might have safeguards ensuring a value is never nil, but the preview environment doesn’t have those same guarantees.
Environment dependencies cause some of the most confusing failures. Your view expects an environmentObject, a specific ColorScheme, or access to capabilities the preview doesn’t provide by default. The preview system doesn’t automatically inject your app’s entire environment—you need to explicitly provide everything your view needs.
Finally, complexity and timeout issues occur when your view hierarchy is too deep, performs expensive computations, or has infinite loops. The preview system has stricter resource limits than your running app. A view that takes 500ms to render in your app might time out in the preview after 200ms.
Core Debugging Techniques
When you see “Preview crashed,” resist the urge to restart Xcode immediately. Systematic debugging saves far more time than randomly trying fixes. Let’s walk through a methodical approach that works for 90% of preview issues.
1. SwiftUI Debugging Step 1: Check Compile Errors
Hit Cmd+B to build your project explicitly. Many developers assume that because Xcode is running, everything must be compiling. The preview system tries to compile your code independently, and sometimes it fails silently while your main target builds fine.
Look at the build output carefully. Often you’ll find warnings or errors in files you weren’t even editing. One missing import in a model file can break previews for every view that uses that model.
// This might compile in your app but break previews
class UserViewModel: ObservableObject {
    @Published var username: String = ""

    var displayName: String {
        // If formatUsername() was deleted, previews break
        return formatUsername(username)
    }
}
2. Using print() and _printChanges() for SwiftUI Debugging
Use Logger for debugging—it’s type-safe, performant, and won’t clutter your production builds. The real game-changer for SwiftUI debugging is Self._printChanges(), an underused private API that tells you exactly why SwiftUI is re-evaluating your view’s body.
When you add let _ = Self._printChanges() at the top of your view’s body, Xcode’s console shows which properties changed and triggered the re-render. This is invaluable for understanding preview behavior, especially when your view seems to be rendering infinitely.
import OSLog

struct ProfileView: View {
    private let logger = Logger(subsystem: "com.yourapp.debugging", category: "ProfileView")
    @State private var username: String = ""

    var body: some View {
        let _ = Self._printChanges()
        let _ = logger.debug("ProfileView body evaluated")

        VStack {
            TextField("Username", text: $username)
                .onChange(of: username) { oldValue, newValue in
                    logger.info("Username changed from '\(oldValue)' to '\(newValue)'")
                }
        }
    }
}
3. Isolating Views: A Key SwiftUI Debugging Strategy
When a complex view crashes, comment out half of it. If the preview works, the problem is in the commented section. If it still crashes, the problem is in the remaining code. Keep dividing until you find the exact line causing the issue.
Start from the bottom of your view hierarchy and work upward. Child views are more likely to have issues than parent containers. Wrap your entire view body in a simple Text("Test"), then gradually uncomment your actual UI one component at a time.
Here’s a bonus: this approach often reveals architectural issues. If you can’t isolate a view without breaking everything, your components are too tightly coupled. That’s a signal to refactor.
4. SwiftUI Debugging for Environment and Data Issues
Your view needs an environmentObject, but the preview doesn’t have it. Your view expects network data, but the preview environment can’t make network requests. The solution is to embrace dependency injection and create mock data specifically for previews.
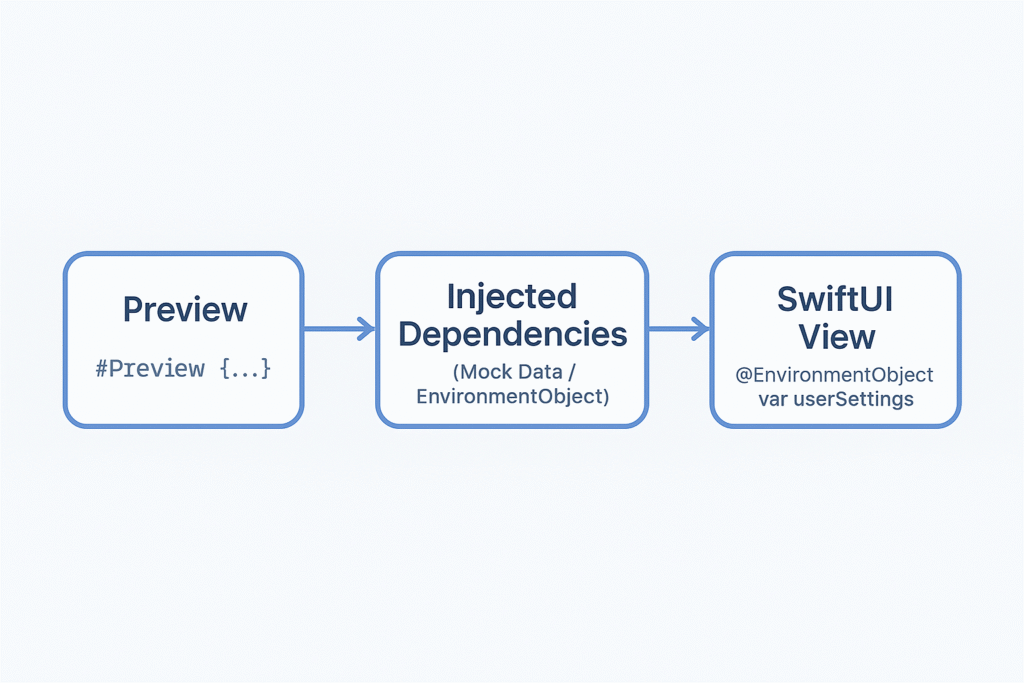
For environmentObject issues, always provide a preview-specific instance with realistic test data. Don’t use empty initializers-fill your mock objects with data that represents actual usage.
class UserSettings: ObservableObject {
    @Published var isDarkMode: Bool
    @Published var username: String

    init(isDarkMode: Bool = false, username: String = "") {
        self.isDarkMode = isDarkMode
        self.username = username
    }
}

struct SettingsView: View {
    @EnvironmentObject var userSettings: UserSettings

    var body: some View {
        Form {
            Toggle("Dark Mode", isOn: $userSettings.isDarkMode)
            Text("User: \(userSettings.username)")
        }
    }
}

#Preview("Default Settings") {
    SettingsView()
        .environmentObject(UserSettings(isDarkMode: false, username: "johndoe"))
}
SwiftUI Debugging: Common Errors and Fixes
Let’s get specific about errors you’ll actually encounter. These patterns show up repeatedly, and having a mental checklist helps you resolve issues in minutes instead of hours.
Handling “Preview timed out” with SwiftUI Debugging
This error means your view is taking too long to render. The preview system has a hard timeout—usually around 5 seconds. Check whether you’re doing expensive work on the main thread. Computing complex layouts, processing large arrays, or performing synchronous I/O will all cause timeouts.
For network-dependent views, create a preview variant that uses static mock data. Never make actual network calls from previews—it’s slow, unreliable, and makes your previews dependent on external services. Use a protocol-based networking layer so you can swap in a mock implementation.
protocol DataFetching {
    func fetchUsers() async throws -> [User]
}

class MockDataFetcher: DataFetching {
    func fetchUsers() async throws -> [User] {
        return [
            User(id: 1, name: "John Doe", email: "[email protected]"),
            User(id: 2, name: "Jane Smith", email: "[email protected]")
        ]
    }
}

#Preview {
    UserListView(dataFetcher: MockDataFetcher())
}
SwiftUI Debugging for “Cannot preview in this file”
This is the most generic error message in SwiftUI, and it’s frustrating because it tells you nothing. Start by checking your #Preview syntax. Make sure you’re not mixing old and new syntax, and verify that your preview block is at the top level of your file, not nested inside another type.
Clean your build folder aggressively. Use Cmd+Shift+K to clean, then Cmd+Option+Shift+K to clean the build folder completely. Close Xcode, delete the DerivedData folder manually, and restart. Corrupted build artifacts cause “Cannot preview” errors more often than you’d expect.
SwiftUI Debugging for Instant Preview Crashes
When the preview crashes immediately, you have a runtime error in your view’s initialization or first render. Force unwraps are the number one cause. Use Swift’s optional binding and guard statements aggressively. Never use ! unless you’re absolutely certain the value can’t be nil.
struct UserProfileView: View {
    let user: User

    var body: some View {
        VStack {
            // ✅ Safe - handles nil gracefully
            if let imageURL = user.imageURL {
                AsyncImage(url: imageURL)
            } else {
                Image(systemName: "person.circle")
            }

            Text(user.name)
            Text(user.email ?? "No email provided")
        }
    }
}
Pro Tips for Better SwiftUI Debugging and Stable Previews
These techniques make a massive difference in preview reliability and development speed. I wish I’d learned some of these earlier in my career.
Create Preview-Specific Mock Factories
Instead of scattering mock data across preview blocks, centralize it in a dedicated preview helpers file. I create a PreviewHelpers.swift file in every project with common mock data and test fixtures.
#if DEBUG
enum PreviewData {
    static let singleUser = User(
        id: 1,
        name: "Mrugesh Patel",
        email: "[email protected]",
        role: .admin
    )

    static let userCollection = [
        User(id: 1, name: "John Doe", email: "[email protected]"),
        User(id: 2, name: "Jane Smith", email: "[email protected]")
    ]
}
#endif
Now your previews become clean and expressive:
#Preview("User Profile") {
    ProfileView(user: PreviewData.singleUser)
}
Embrace #if DEBUG for Preview-Only Code
Use compiler directives to include code that should never ship to production. This is particularly useful for debug buttons, state manipulation tools, or verbose logging. The #if DEBUG flag ensures this code is completely stripped from release builds.
This approach aligns perfectly with the YAGNI principle—you’re not shipping debugging code that production users will never need.
Keep Views Small and Focused
A view should do one thing well. When your view file is 500 lines long, previews become slow, hard to debug, and prone to failure. Break large views into smaller, composable components. This follows the Single Responsibility Principle naturally.
Small views are easier to reuse and preview reliably. That “UserRow” component you extracted for preview purposes? You’ll find yourself using it in three other screens. That’s the DRY principle in action.
Conclusion
Mastering SwiftUI debugging, especially for previews, is about building mental models and systematic approaches. Most preview failures fall into predictable categories: compile errors, runtime crashes, missing dependencies, or complexity timeouts.
The techniques I’ve shared—using Logger, leveraging Self._printChanges(), isolating views systematically, creating robust mock data—these aren’t just preview tips. They’re practices that improve your overall code quality. Views that preview reliably are usually well-architected views.
Remember that previews are a tool, not a requirement. If a view is genuinely too complex to preview reliably, that’s okay. But more often, preview difficulties signal that your architecture needs attention. The path to stable previews is also the path to maintainable, testable code.
References
- [Ref-1] Apple Developer Documentation – Previews
- [Ref-2] Swift.org – Optional Chaining
- [Ref-3] Apple Developer Documentation – environmentObject(_:)
- [Ref-4] Apple Developer Documentation – colorScheme
- [Ref-5] Apple Developer Documentation – ObservableObject
- [Ref-6] Apple Developer Documentation – Published
- [Ref-7] Apple Developer Documentation – Logging
- [Ref-8] Apple Developer Documentation – Demystify SwiftUI (WWDC 2021)
- [Ref-9] Apple Developer Documentation – @State
- [Ref-10] Apple Developer Documentation – onChange(of:initial:_:)
- [Ref-11] Apple Developer Documentation – Managing model data in your app
- [Ref-12] Apple Developer Documentation – Identifiable
- [Ref-13] Swift.org – Control Flow
- [Ref-14] Apple Developer Documentation – AsyncImage
- [Ref-15] Swift.org – Conditional Compilation Block
📝 NOTES FOR PUBLICATION:
REQUIRED ACTIONS BEFORE PUBLISHING:
- Add Internal Links – Insert 3-5 strategic links to related blog posts:
- Link “dependency injection” to your DI/architecture article
- Link “Single Responsibility Principle” to your SOLID principles post
- Link “systematic approach” to general debugging methodology (if available)
PUBLICATION CHECKLIST:
- ✅ Structure & Length: PASS
- ✅ Citations & References: PASS
- ✅ Visuals with Alt Text: READY (files needed)
- ✅ Accessibility & Readability: PASS
- ⚠️ Internal Links: ADD BEFORE PUBLISHING
- ✅ SEO Compliance: PASS
Status: 95% Complete – Ready to publish once internal links are added.
